Market Outlook
June 15, 2017
Market Cues
Domestic Indices
Chg (%)
(Pts)
(Close)
Indian markets are likely to trade in negative zone tracking the SGX Nifty and Asian
BSE Sensex
0.2
52
31,156
markets.
Nifty
0.1
11
9,618
US markets showed a lack of direction throughout much of the trading session on
Mid Cap
0.0
91
14,799
Wednesday before ending the session mixed. The narrow Dow climbed to a new
Small Cap
0.5
171
15,589
record closing high. The mixed closed on Wall Street came after the Federal Reserve
raised its benchmark interest rate for the third time in three months despite signs the
Bankex
0.1
28
26,571
U.S. economy has cooled off in 2017.
Global Indices
Chg (%)
(Pts)
(Close)
The European markets got off to a positive start Wednesday and climbed for the
majority of the morning. Positive economic data from China and the continued
Dow Jones
0.2
146
21,375
rebound in tech stocks helped to fuel the early gains.
Nasdaq
(0.4)
(25)
6,195
FTSE
(0.3)
(26)
7,474
Indian markets closed marginally higher on Wednesday, with state-run banks
pacing the gainers, after reports that the Reserve Bank of India (RBI) is pushing for
Nikkei
(0.1)
(15)
19,884
bankruptcy proceedings against 12 corporate borrowers representing about 25
Hang Seng
0.1
224
25,876
percent of the gross bad loans in the banking system.
Shanghai Com
(0.7)
(23)
3,131
News Analysis
Advances / Declines
BSE
NSE
Dr Reddy’s - EIR for its Miryalaguda API
Detailed analysis on Pg2
Advances
1,217
1,783
Declines
1,471
885
Investor’s Ready Reckoner
Unchanged
163
82
Key Domestic & Global Indicators
Stock Watch: Latest investment recommendations on 150+ stocks
Volumes (` Cr)
Refer Pg5 onwards
BSE
3,629
Top Picks
NSE
24,345
CMP
Target
Upside
Company
Sector
Rating
(`)
(`)
(%)
Blue Star
Capital Goods
Buy
645
760
17.8
#Net Inflows (` Cr)
Net
Mtd
Ytd
Dewan Housing Fin. Financials
Buy
446
520
16.5
FII
(4,909
(23,415
55,383
Mahindra Lifespace Real Estate
Buy
447
522
16.9
MFs
804(9)
2,412
32,451
Navkar Corporation Others
Buy
221
265
19.8
KEI Industries
Capital Goods
Buy
211
258
22.0
Top Gainers
Price (`)
Chg (%)
More Top Picks on Pg3
Ucobank
137
10.6
Key Upcoming Events
Denabank
36
8.7
Previous
Consensus
Date
Region
Event Description
Reading
Expectations
Gppl
147
7.9
Jun 15, 2017 US
Initial Jobless claims
245.00
241.00
Albk
72
7.7
Jun 15, 2017 India
Imports YoY%
49.10
Cub
188
7.2
Jun 15, 2017 India
Exports YoY%
19.80
Jun 15, 2017 US
Industrial Production
0.98
0.20
Top Losers
Price (`)
Chg (%)
Jun 15, 2017 UK
BOE Announces rates
0.25
0.25
Jun 16, 2017 Euro Zone Euro-Zone CPI (YoY)
1.40
1.40
Videoind
225
(4.8)
More Events on Pg4
Punjlloyd
19
(4.7)
Aban
173
(4.1)
Escorts
717
(3.3)
Repcohome
880
(3.1)
#as on 14th June, 2017
Market Outlook
June 15, 2017
News Analysis
Dr Reddy’s - EIR for its Miryalaguda API
Dr Reddy's Laboratories, received establishment inspection report from the US
health regulator for its Miryalaguda plant. We have received establishment
inspection report (EIR) from US FDA for its active pharmaceutical plant (API) at
Miryalaguda indicating the successful closure of the agency's audit. The plant,
which was inspected by USFDA from February 13-21’2017, had received Form
483 with three observations from US Food and Drug Administration. Miryalaguda
plant supplies active ingredients for company’s captive consumption as well as for
its customers. The news is positive, however given the valuations, we are neutral
on the stock.
Economic and Political News
4G equipment import by service providers to attract 10% customs duty
Andhra Pradesh allots land for projects worth `17,808cr
ONGC keen to buy govt stake in refiner HPCL: Dharmendra Pradhan
FIEO seeks inclusion of textile job work under 5% GST slab
Saudi Aramco seeks exclusive talks over India oil refinery stake: Pradhan
Corporate News
JSPL's Chhattisgarh iron ore mine in trouble, as locals want lease scrapped
Two more plants planned in cement-saturated South
GST effect: Bajaj reduces prices on bikes by up to `4,500
BPCL eyes Bina refinery expansion to 310,000 bpd in 4-5 years: Official
Wipro ups stake to 26.1% in cloud solution firm Drivestream
Market Outlook
June 15, 2017
Top Picks ★★★★★
Market Cap
CMP
Target
Upside
Company
Rationale
(` Cr)
(`)
(`)
(%)
Strong growth in domestic business due to its leadership
in acute therapeutic segment. Alkem expects to launch
Alkem Laboratories
22,308
1,866
2,161
15.8
more products in USA, which bodes for its international
business.
We expect the company would report strong profitability
Asian Granito
1,199
398
447
12.2
owing to better product mix, higher B2C sales and
amalgamation synergy.
Favourable outlook for the AC industry to augur well for
Cooling products business which is out pacing the market
Blue Star
6,166
645
760
17.8
growth. EMPPAC division's profitability to improve once
operating environment turns around.
With a focus on the low and medium income (LMI)
consumer segment, the company has increased its
Dewan Housing Finance
13,988
446
520
16.5
presence in tier-II & III cities where the growth opportunity
is immense.
Loan growth is likely to pick up after a sluggish FY17.
Karur Vysya Bank
8,790
145
160
10.0
Lower credit cost will help in strong bottomline growth.
Increasing share of CASA will help in NIM improvement.
Economic recovery to have favourable impact on
advertising & circulation revenue growth. Further, the
Jagran Prakashan
5,971
183
225
23.2
acquisition of a radio business (Radio City) would also
boost the company's revenue growth.
High order book execution in EPC segment, rising B2C
KEI Industries
1,645
211
258
22.0
sales and higher exports to boost the revenues and
profitability
Speedier execution and speedier sales, strong revenue
Mahindra Lifespace
2,292
447
522
16.9
visibilty in short-to-long run, attractive valuations
Massive capacity expansion along with rail advantage at
Navkar Corporation
3,155
221
265
19.8
ICD as well CFS augurs well for the company
Strong brands and distribution network would boost
Siyaram Silk Mills
2,166
2,310
2,500
8.2
growth going ahead. Stock currently trades at an
inexpensive valuation.
Market leadership in Hindi news genre and no.
2
viewership ranking in English news genre, exit from the
TV Today Network
1,567
263
344
31.0
radio business, and anticipated growth in ad spends by
corporates to benefit the stock.
Source: Company, Angel Research
Market Outlook
June 15, 2017
Key Upcoming Events
Global economic events release calendar
Bloomberg Data
Date
Time
Country
Event Description
Unit
Period
Last Reported
Estimated
Jun 15, 2017
6:00 PMUS
Initial Jobless claims
Thousands
Jun 10
245.00
241.00
India
Imports YoY%
% Change
May
49.10
India
Exports YoY%
% Change
May
19.80
6:45 PMUS
Industrial Production
%
May
0.98
0.20
4:30 PMUK
BOE Announces rates
% Ratio
Jun 15
0.25
0.25
Jun 16, 2017
2:30 PMEuro Zone Euro-Zone CPI (YoY)
%
May F
1.40
1.40
6:00 PMUS
Housing Starts
Thousands
May
1,172.00
1,218.00
6:00 PMUS
Building permits
Thousands
May
1,228.00
1,249.00
Jun 21, 2017
7:30 PMUS
Existing home sales
Million
May
5.57
5.55
Jun 22, 2017
7:30 PMEuro Zone Euro-Zone Consumer Confidence
Value
Jun A
(3.30)
Jun 23, 2017
1:00 PMGermany PMI Services
Value
Jun P
55.40
1:00 PMGermany PMI Manufacturing
Value
Jun P
59.50
7:30 PMUS
Consumer Confidence
S.A./ 1985=100 Jun
117.90
Jun 27, 2017
7:30 PMUS
New home sales
Thousands
May
569.00
600.00
Jun 29, 2017
6:00 PMUS
GDP Qoq (Annualised)
% Change
1Q T
1.20
Jun 30, 2017
1:25 PMGermany Unemployment change (000's)
Thousands
Jun
(9.00)
6:30 AMChina
PMI Manufacturing
Value
Jun
51.20
2:00 PMUK
GDP (YoY)
% Change
1Q F
2.00
Jul 03, 2017
2:00 PMUK
PMI Manufacturing
Value
Jun
56.70
Jul 07, 2017
2:00 PMUK
Industrial Production (YoY)
% Change
May
(0.80)
6:00 PMUS
Change in Nonfarm payrolls
Thousands
Jun
138.00
6:00 PMUS
Unnemployment rate
%
Jun
4.30
Source: Bloomberg, Angel Research
Market Outlook
June 15, 2017
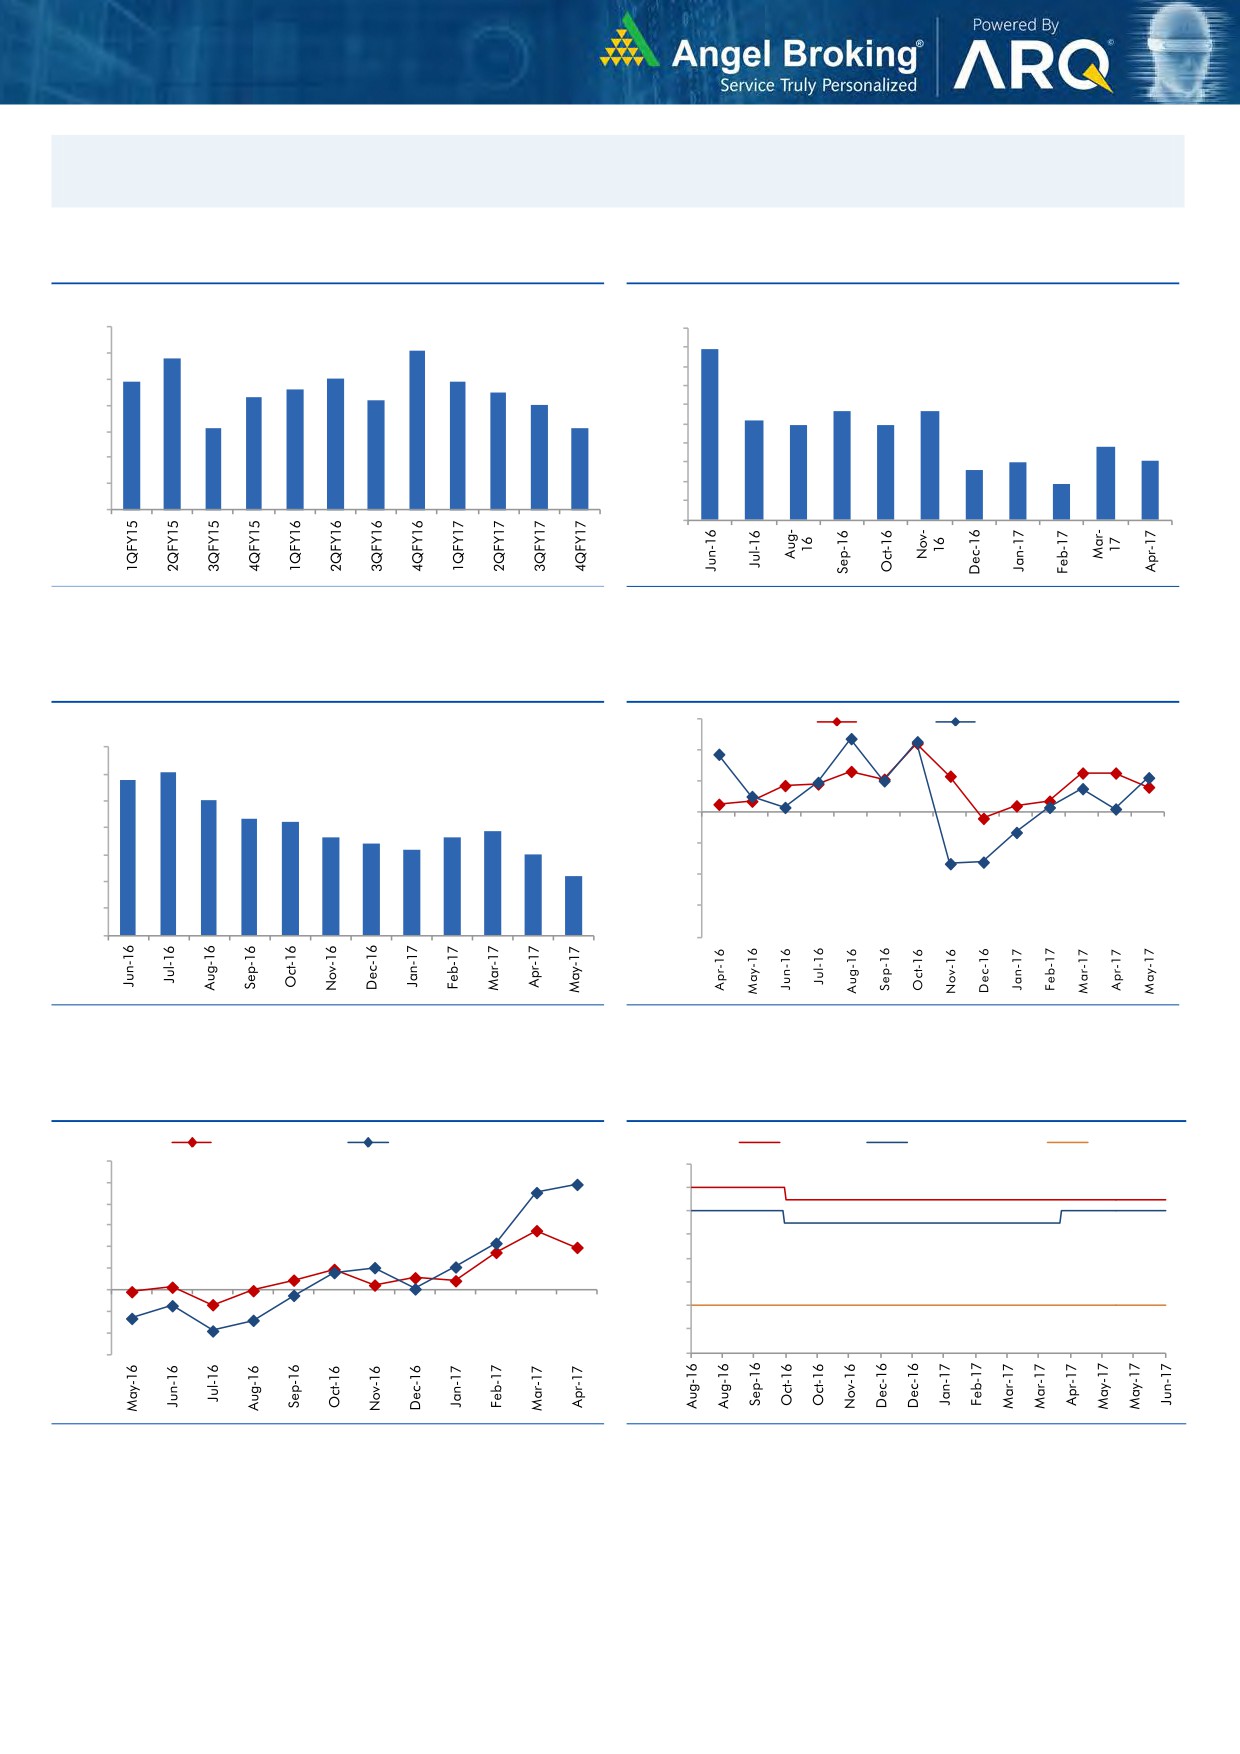
Macro watch
Exhibit 1: Quarterly GDP trends
Exhibit 2: IIP trends
(%)
(%)
10.0
10.0
9.1
8.9
8.8
9.0
9.0
7.9
8.0
7.9
8.0
7.6
7.5
8.0
7.3
7.2
7.0
7.0
5.7
5.7
7.0
6.0
5.2
6.1
6.1
4.9
4.9
5.0
6.0
3.8
4.0
3.0
3.1
5.0
2.6
3.0
1.9
4.0
2.0
1.0
3.0
-
Source: CSO, Angel Research
Source: MOSPI, Angel Research
Exhibit 3: Monthly CPI inflation trends
Exhibit 4: Manufacturing and services PMI
56.0
Mfg. PMI
Services PMI
(%)
7.0
54.0
6.1
5.8
6.0
5.1
52.0
5.0
4.3
4.2
3.9
50.0
3.6
3.7
4.0
3.4
3.2
3.0
48.0
3.0
2.2
46.0
2.0
1.0
44.0
-
42.0
Source: MOSPI, Angel Research
Source: Market, Angel Research; Note: Level above 50 indicates expansion
Exhibit 5: Exports and imports growth trends
Exhibit 6: Key policy rates
(%)
Exports yoy growth
Imports yoy growth
(%)
Repo rate
Reverse Repo rate
CRR
60.0
7.00
50.0
6.50
40.0
6.00
30.0
5.50
20.0
5.00
10.0
4.50
0.0
4.00
(10.0)
(20.0)
3.50
(30.0)
3.00
Source: Bloomberg, Angel Research
Source: RBI, Angel Research
Market Outlook
June 15, 2017
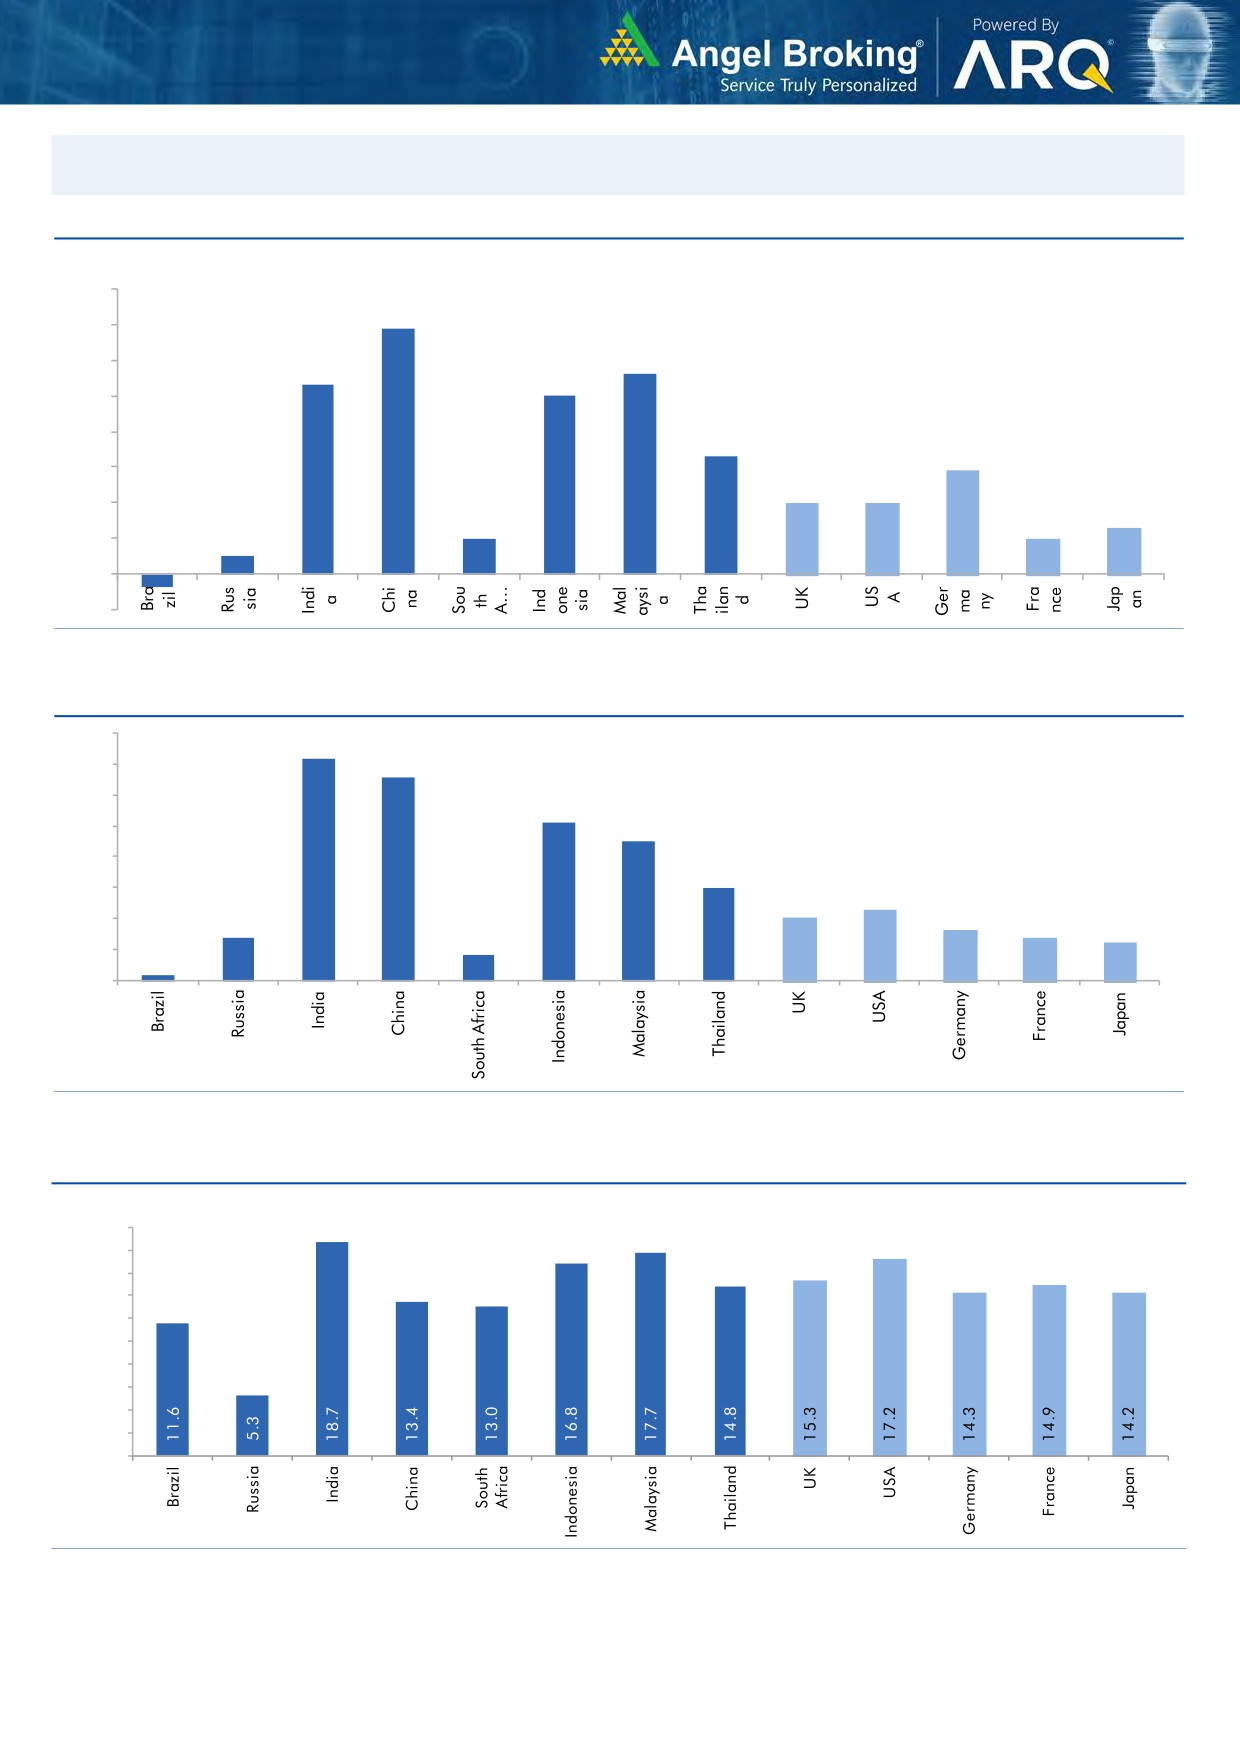
Global watch
Exhibit 1: Latest quarterly GDP Growth (%, yoy) across select developing and developed countries
(%)
8.0
6.9
7.0
6.0
5.6
5.3
5.0
5.0
1.0
4.0
3.3
2.9
3.0
2.0
2.0
2.0
0.5
1.3
1.0
1.0
-
(1.0)
(0.4)
Source: Bloomberg, Angel Research
Exhibit 2: 2016 GDP Growth projection by IMF (%, yoy) across select developing and developed countries
(%)
7.2
6.6
7.0
6.0
5.1
5.0
4.5
4.0
3.0
3.0
2.3
2.0
1.4
1.6
2.0
1.4
1.2
0.2
0.8
1.0
-
Source: IMF, Angel Research
Exhibit 3: One year forward P-E ratio across select developing and developed countries
(x)
20.0
18.0
16.0
14.0
12.0
10.0
8.0
6.0
4.0
2.0
-
Source: IMF, Angel Research
Market Outlook
June 15, 2017
Exhibit 4: Relative performance of indices across globe
Returns (%)
Country
Name of index
Closing price
1M
3M
1YR
Brazil
Bovespa
61,923
(9.6)
(5.5)
24.7
Russia
Micex
1,838
(7.8)
(6.9)
(1.7)
India
Nifty
9,618
1.8
7.7
17.2
China
Shanghai Composite
3,131
1.3
(2.8)
7.2
South Africa
Top 40
45,085
(5.0)
2.6
(4.1)
Mexico
Mexbol
49,291
(0.8)
4.6
9.5
Indonesia
LQ45
974
2.4
8.1
17.2
Malaysia
KLCI
1,792
0.9
4.1
8.7
Thailand
SET 50
993
1.3
1.6
7.8
USA
Dow Jones
21,375
2.3
2.6
21.2
UK
FTSE
7,474
0.5
1.8
25.6
Japan
Nikkei
19,884
0.1
1.4
19.2
Germany
DAX
12,806
0.3
7.0
28.5
France
CAC
5,243
(3.2)
4.9
19.7
Source: Bloomberg, Angel Research
Stock Watch
June 15, 2017
Company Name
Reco
CMP
Target
Mkt Cap
Sales ( Čcr )
OPM(%)
EPS (Č)
PER(x)
P/BV(x)
RoE(%)
EV/Sales(x)
(Č)
Price ( Č)
( Č cr )
FY17E FY18E
FY17E
FY18E
FY17E
FY18E
FY17E
FY18E
FY17E
FY18E
FY17E
FY18E
FY17E
FY18E
Agri / Agri Chemical
Rallis
Neutral
248
-
4,817
1,937
2,164
13.3
14.3
9.0
11.0
27.5
22.5
4.8
4.2
18.4
19.8
2.5
2.2
United Phosphorus
Neutral
847
-
43,025
15,176
17,604
18.5
18.5
37.4
44.6
22.7
19.0
4.4
3.7
21.4
21.2
2.9
2.5
Auto & Auto Ancillary
Ashok Leyland
Buy
95
111
26,936
20,021
21,915
11.6
11.9
4.5
5.3
21.0
17.8
4.3
3.8
20.6
21.5
1.3
1.2
Bajaj Auto
Neutral
2,831
-
81,923
25,093
27,891
19.5
19.2
143.9
162.5
19.7
17.4
5.5
4.7
30.3
29.4
3.0
2.6
Bharat Forge
Neutral
1,173
-
27,296
7,726
8,713
20.5
21.2
35.3
42.7
33.2
27.5
6.1
5.5
18.9
20.1
3.6
3.1
Eicher Motors
Neutral
29,050
-
79,079
16,583
20,447
17.5
18.0
598.0
745.2
48.6
39.0
16.6
12.6
41.2
38.3
4.6
3.7
Gabriel India
Neutral
149
-
2,136
1,544
1,715
9.0
9.3
5.4
6.3
27.5
23.6
5.2
4.6
18.9
19.5
1.3
1.2
Hero Motocorp
Neutral
3,787
-
75,618
28,083
30,096
15.3
15.7
171.8
187.0
22.0
20.3
7.7
6.5
30.1
27.9
2.5
2.3
Jamna Auto Industries Neutral
275
-
2,189
1,486
1,620
9.8
9.9
15.0
17.2
18.3
16.0
4.0
3.4
21.8
21.3
1.5
1.4
L G Balakrishnan & Bros Neutral
756
-
1,187
1,302
1,432
11.6
11.9
43.7
53.0
17.3
14.3
2.4
2.2
13.8
14.2
1.0
0.9
Mahindra and Mahindra Neutral
1,405
-
87,270
46,534
53,077
11.6
11.7
67.3
78.1
20.9
18.0
3.4
3.0
15.4
15.8
1.8
1.6
Maruti
Neutral
7,348
-
221,961
67,822
83,288
16.0
16.4
253.8
312.4
29.0
23.5
6.7
5.4
23.0
22.9
2.9
2.3
Minda Industries
Neutral
596
-
5,154
2,728
3,042
9.0
9.1
68.2
86.2
8.7
6.9
2.0
1.6
23.8
24.3
2.0
1.7
Motherson Sumi
Neutral
478
-
67,117
45,896
53,687
7.8
8.3
13.0
16.1
36.7
29.7
11.8
9.4
34.7
35.4
1.5
1.3
Rane Brake Lining
Neutral
1,348
-
1,067
511
562
11.3
11.5
28.1
30.9
48.0
43.6
7.3
6.7
15.3
15.0
2.2
2.0
Setco Automotive
Neutral
37
-
497
741
837
13.0
13.0
15.2
17.0
2.5
2.2
0.4
0.4
15.8
16.3
1.1
1.0
Tata Motors
Neutral
452
-
130,393
300,209
338,549
8.9
8.4
42.7
54.3
10.6
8.3
1.7
1.4
15.6
17.2
0.6
0.5
TVS Motor
Neutral
546
-
25,930
13,390
15,948
6.9
7.1
12.8
16.5
42.8
33.0
10.6
8.4
26.3
27.2
2.0
1.6
Amara Raja Batteries
Buy
845
1,009
14,435
5,305
6,100
16.0
16.3
28.4
34.0
29.8
24.9
5.7
4.8
19.3
19.3
2.7
2.4
Exide Industries
Neutral
226
-
19,210
7,439
8,307
15.0
15.0
8.1
9.3
27.9
24.3
3.9
3.5
14.3
16.7
2.2
2.0
Apollo Tyres
Neutral
258
-
13,151
12,877
14,504
14.3
13.9
21.4
23.0
12.1
11.2
1.9
1.6
16.4
15.2
1.2
1.1
Ceat
Neutral
1,858
-
7,517
7,524
8,624
13.0
12.7
131.1
144.3
14.2
12.9
2.6
2.2
19.8
18.6
1.1
0.9
JK Tyres
Neutral
174
-
3,956
7,455
8,056
15.0
15.0
21.8
24.5
8.0
7.1
1.7
1.4
22.8
21.3
0.7
0.6
Swaraj Engines
Neutral
2,274
-
2,825
660
810
15.2
16.4
54.5
72.8
41.7
31.2
13.0
11.8
31.5
39.2
4.1
3.3
Subros
Neutral
261
-
1,566
1,488
1,681
11.7
11.9
6.4
7.2
40.8
36.4
4.3
3.9
10.8
11.4
1.3
1.1
Indag Rubber
Neutral
226
-
593
286
326
19.8
16.8
11.7
13.3
19.3
16.9
3.3
3.1
17.8
17.1
1.7
1.5
Capital Goods
ACE
Neutral
64
-
636
709
814
4.1
4.6
1.4
2.1
45.9
30.6
1.9
1.8
4.4
6.0
1.1
0.9
BEML
Neutral
1,344
-
5,596
3,451
4,055
6.3
9.2
31.4
57.9
42.8
23.2
2.6
2.3
6.3
10.9
1.7
1.5
Bharat Electronics
Neutral
166
-
37,078
8,137
9,169
16.8
17.2
58.7
62.5
2.8
2.7
0.4
0.4
44.6
46.3
3.5
3.2
Stock Watch
June 15, 2017
Company Name
Reco
CMP
Target
Mkt Cap
Sales ( Čcr )
OPM(%)
EPS (Č)
PER(x)
P/BV(x)
RoE(%)
EV/Sales(x)
(Č)
Price ( Č)
( Č cr )
FY17E
FY18E
FY17E
FY18E
FY17E
FY18E
FY17E
FY18E
FY17E
FY18E
FY17E
FY18E
FY17E
FY18E
Capital Goods
Voltas
Neutral
492
-
16,276
6,511
7,514
7.9
8.7
12.9
16.3
38.1
30.2
6.9
6.0
16.7
18.5
2.3
1.9
BGR Energy
Neutral
153
-
1,102
16,567
33,848
6.0
5.6
7.8
5.9
19.6
25.9
1.1
1.1
4.7
4.2
0.2
0.1
BHEL
Neutral
139
-
33,960
28,797
34,742
-
2.8
2.3
6.9
60.3
20.1
1.0
1.0
1.3
4.8
0.8
0.6
Blue Star
Buy
645
760
6,166
4,283
5,077
5.9
7.3
14.9
22.1
43.3
29.1
8.4
7.1
20.4
26.4
1.5
1.3
CG Power and Industrial
Neutral
82
-
5,139
5,777
6,120
5.9
7.0
3.3
4.5
24.9
18.2
1.1
1.0
4.4
5.9
0.8
0.7
Solutions
Greaves Cotton
Neutral
164
-
4,010
1,755
1,881
16.8
16.9
7.8
8.5
21.1
19.3
4.2
3.9
20.6
20.9
2.0
1.8
Inox Wind
Neutral
136
-
3,024
5,605
6,267
15.7
16.4
24.8
30.0
5.5
4.5
1.5
1.1
25.9
24.4
0.6
0.5
KEC International
Neutral
257
-
6,614
9,294
10,186
7.9
8.1
9.9
11.9
26.0
21.6
3.8
3.3
15.6
16.3
0.9
0.9
KEI Industries
Buy
211
258
1,645
2,633
3,001
10.4
10.0
12.7
13.0
16.6
16.3
3.6
3.0
21.4
18.2
0.8
0.7
Thermax
Neutral
964
-
11,481
5,421
5,940
7.3
7.3
25.7
30.2
37.5
31.9
4.5
4.1
12.2
13.1
2.0
1.8
VATech Wabag
Neutral
684
-
3,733
3,136
3,845
8.9
9.1
26.0
35.9
26.3
19.1
3.3
2.8
13.4
15.9
1.1
0.9
Cement
ACC
Neutral
1,599
-
30,033
11,225
13,172
13.2
16.9
44.5
75.5
35.9
21.2
3.4
3.1
11.2
14.2
2.7
2.3
Ambuja Cements
Neutral
234
-
46,405
9,350
10,979
18.2
22.5
5.8
9.5
40.3
24.6
3.4
3.0
10.2
12.5
5.0
4.2
India Cements
Neutral
209
-
6,428
4,364
4,997
18.5
19.2
7.9
11.3
26.5
18.5
1.9
1.9
8.0
8.5
2.2
2.0
JK Cement
Neutral
1,047
-
7,323
4,398
5,173
15.5
17.5
31.2
55.5
33.6
18.9
4.0
3.5
12.0
15.5
2.2
1.8
J K Lakshmi Cement
Neutral
481
-
5,658
2,913
3,412
14.5
19.5
7.5
22.5
64.1
21.4
3.9
3.3
12.5
18.0
2.5
2.1
Orient Cement
Neutral
149
-
3,042
2,114
2,558
18.5
20.5
8.1
11.3
18.3
13.1
2.7
2.3
9.0
14.0
2.1
1.6
UltraTech Cement
Neutral
4,050
-
111,193
25,768
30,385
21.0
23.5
111.0
160.0
36.5
25.3
4.7
4.1
13.5
15.8
4.4
3.7
Construction
ITNL
Neutral
98
-
3,237
8,946
10,017
31.0
31.6
8.1
9.1
12.2
10.8
0.5
0.5
4.2
5.0
3.7
3.4
KNR Constructions
Neutral
209
-
2,945
1,385
1,673
14.7
14.0
41.2
48.5
5.1
4.3
1.0
0.8
14.9
15.2
2.2
1.8
Larsen & Toubro
Neutral
1,761
-
164,417
111,017
124,908
11.0
11.0
61.1
66.7
28.8
26.4
3.5
3.2
13.1
12.9
2.5
2.3
Gujarat Pipavav Port
Neutral
147
-
7,126
705
788
52.2
51.7
5.0
5.6
29.5
26.3
2.9
2.6
11.2
11.2
9.8
8.2
Nagarjuna Const.
Neutral
91
-
5,048
8,842
9,775
9.1
8.8
5.3
6.4
17.1
14.2
1.4
1.2
8.2
9.1
0.7
0.6
PNC Infratech
Neutral
148
-
3,794
2,350
2,904
13.1
13.2
9.0
8.8
16.4
16.8
0.6
0.5
15.9
13.9
1.7
1.4
Simplex Infra
Neutral
533
-
2,639
6,829
7,954
10.5
10.5
31.4
37.4
17.0
14.3
1.8
1.6
9.9
13.4
0.8
0.7
Power Mech Projects
Neutral
586
-
862
1,801
2,219
12.7
14.6
72.1
113.9
8.1
5.2
1.5
1.3
16.8
11.9
0.5
0.4
Sadbhav Engineering
Neutral
306
-
5,247
3,598
4,140
10.3
10.6
9.0
11.9
34.0
25.7
3.6
3.1
9.9
11.9
1.7
1.5
NBCC
Neutral
199
-
17,888
7,428
9,549
7.9
8.6
8.2
11.0
24.2
18.1
1.2
1.0
28.2
28.7
2.1
1.6
MEP Infra
Neutral
93
-
1,509
1,877
1,943
30.6
29.8
3.0
4.2
30.9
22.1
15.0
10.1
0.6
0.6
2.2
2.0
Stock Watch
June 15, 2017
Company Name
Reco
CMP
Target
Mkt Cap
Sales ( Čcr )
OPM(%)
EPS (Č)
PER(x)
P/BV(x)
RoE(%)
EV/Sales(x)
(Č)
Price ( Č)
( Č cr )
FY17E
FY18E
FY17E
FY18E
FY17E
FY18E
FY17E
FY18E
FY17E
FY18E
FY17E
FY18E
FY17E
FY18E
Construction
SIPL
Neutral
110
-
3,883
1,036
1,252
65.5
66.2
(8.4)
(5.6)
4.1
4.7
(22.8)
(15.9)
12.0
10.0
Engineers India
Neutral
156
-
10,526
1,725
1,935
16.0
19.1
11.4
13.9
13.7
11.2
1.9
1.8
13.4
15.3
5.0
4.5
Financials
Axis Bank
Accumulate
508
580
121,804
46,932
53,575
3.5
3.4
32.4
44.6
15.7
11.4
2.0
1.8
13.6
16.5
-
-
Bank of Baroda
Neutral
173
-
39,862
19,980
23,178
1.8
1.8
11.5
17.3
15.0
10.0
1.7
1.4
8.3
10.1
-
-
Canara Bank
Neutral
356
-
21,234
15,225
16,836
1.8
1.8
14.5
28.0
24.5
12.7
1.7
1.4
5.8
8.5
-
-
Can Fin Homes
Neutral
3,065
-
8,160
420
526
3.5
3.5
86.5
107.8
35.4
28.4
7.6
6.2
23.6
24.1
-
-
Cholamandalam Inv. &
Accumulate
1,094
1,230
17,099
2,012
2,317
6.3
6.3
42.7
53.6
25.6
20.4
4.1
3.5
16.9
18.3
-
-
Fin. Co.
Dewan Housing Finance Buy
446
520
13,988
2,225
2,688
2.9
2.9
29.7
34.6
15.0
12.9
2.4
1.6
16.1
14.8
-
-
Equitas Holdings
Buy
153
235
5,159
939
1,281
11.7
11.5
5.8
8.2
26.3
18.6
2.3
2.0
10.9
11.5
-
-
Federal Bank
Accumulate
116
125
20,079
8,259
8,995
3.0
3.0
4.3
5.6
27.1
20.8
2.3
2.1
8.5
10.1
-
-
HDFC
Neutral
1,651
-
262,405
11,475
13,450
3.4
3.4
45.3
52.5
36.5
31.5
7.0
6.2
20.2
20.5
-
-
HDFC Bank
Neutral
1,671
-
429,211
46,097
55,433
4.5
4.5
58.4
68.0
28.6
24.6
5.0
4.2
18.8
18.6
-
-
ICICI Bank
Neutral
319
-
186,018
42,800
44,686
3.1
3.3
18.0
21.9
17.7
14.6
2.4
2.2
11.1
12.3
-
-
Karur Vysya Bank
Accumulate
145
160
8,790
5,640
6,030
3.3
3.2
8.9
10.0
16.3
14.5
1.7
1.6
11.2
11.4
-
-
Lakshmi Vilas Bank
Neutral
195
-
3,743
3,339
3,799
2.7
2.8
11.0
14.0
17.7
13.9
1.8
1.7
11.2
12.7
-
-
LIC Housing Finance
Neutral
774
-
39,066
3,712
4,293
2.6
2.5
39.0
46.0
19.9
16.8
3.7
3.2
19.9
20.1
-
-
Punjab Natl.Bank
Neutral
152
-
32,313
23,532
23,595
2.3
2.4
6.8
12.6
22.3
12.1
3.5
2.5
3.3
6.5
-
-
RBL Bank
Neutral
518
-
19,489
1,783
2,309
2.6
2.6
12.7
16.4
40.8
31.6
4.5
4.0
12.8
13.3
-
-
Repco Home Finance
Neutral
879
-
5,496
388
457
4.5
4.2
30.0
38.0
29.3
23.1
4.9
4.1
18.0
19.2
-
-
South Ind.Bank
Neutral
29
-
5,239
6,435
7,578
2.5
2.5
2.7
3.1
10.8
9.4
1.4
1.2
10.1
11.2
-
-
St Bk of India
Neutral
284
-
230,604
88,650
98,335
2.6
2.6
13.5
18.8
21.1
15.1
2.0
1.8
7.0
8.5
-
-
Union Bank
Neutral
155
-
10,621
13,450
14,925
2.3
2.3
25.5
34.5
6.1
4.5
0.9
0.8
7.5
10.2
-
-
Yes Bank
Neutral
1,449
-
66,246
8,978
11,281
3.3
3.4
74.0
90.0
19.6
16.1
3.7
3.2
17.0
17.2
-
-
FMCG
Akzo Nobel India
Neutral
1,890
-
9,063
2,955
3,309
13.3
13.7
57.2
69.3
33.1
27.3
10.8
9.1
32.7
33.3
2.9
2.5
Asian Paints
Neutral
1,149
-
110,164
17,128
18,978
16.8
16.4
19.1
20.7
60.1
55.5
20.9
19.7
34.8
35.5
6.4
5.7
Britannia
Neutral
3,611
-
43,328
9,594
11,011
14.6
14.9
80.3
94.0
45.0
38.4
18.5
14.3
41.2
-
4.4
3.8
Colgate
Neutral
1,072
-
29,166
4,605
5,149
23.4
23.4
23.8
26.9
45.1
39.9
24.9
19.5
64.8
66.8
6.3
5.6
Dabur India
Neutral
290
-
51,049
8,315
9,405
19.8
20.7
8.1
9.2
35.8
31.5
10.0
8.3
31.6
31.0
5.8
5.1
GlaxoSmith Con*
Neutral
5,334
-
22,432
4,350
4,823
21.2
21.4
179.2
196.5
29.8
27.2
7.9
6.7
27.1
26.8
4.5
4.0
Stock Watch
June 15, 2017
Company Name
Reco
CMP
Target
Mkt Cap
Sales ( Čcr )
OPM(%)
EPS (Č)
PER(x)
P/BV(x)
RoE(%)
EV/Sales(x)
(Č)
Price ( Č)
( Č cr )
FY17E FY18E
FY17E
FY18E
FY17E
FY18E
FY17E
FY18E
FY17E
FY18E
FY17E
FY18E
FY17E
FY18E
FMCG
Godrej Consumer
Neutral
1,890
-
64,377
10,235
11,428
18.4
18.6
41.1
44.2
46.0
42.8
10.2
8.6
24.9
24.8
6.4
5.6
HUL
Neutral
1,113
-
240,829
35,252
38,495
17.8
17.8
20.7
22.4
53.9
49.7
51.5
44.2
95.6
88.9
6.7
6.1
ITC
Neutral
300
-
364,118
40,059
44,439
38.3
39.2
9.0
10.1
33.4
29.6
9.3
8.1
27.8
27.5
8.6
7.7
Marico
Neutral
316
-
40,818
6,430
7,349
18.8
19.5
6.4
7.7
49.4
41.1
14.9
12.6
33.2
32.5
6.2
5.3
Nestle*
Neutral
6,678
-
64,390
10,073
11,807
20.7
21.5
124.8
154.2
53.5
43.3
22.0
19.8
34.8
36.7
6.2
5.3
Tata Global
Neutral
158
-
10,000
8,675
9,088
9.8
9.8
7.4
8.2
21.4
19.3
1.7
1.6
7.9
8.1
1.1
1.0
Procter & Gamble
Neutral
8,015
-
26,017
2,939
3,342
23.2
23.0
146.2
163.7
54.8
49.0
13.9
11.5
25.3
23.5
8.4
7.3
Hygiene
IT
HCL Tech^
Buy
853
1,014
121,743
46,723
52,342
22.1
20.9
60.0
62.8
14.2
13.6
3.6
3.1
25.3
22.4
2.3
2.0
Infosys
Buy
959
1,179
220,197
68,484
73,963
26.0
26.0
63.0
64.0
15.2
15.0
3.2
2.9
20.8
19.7
2.9
2.5
TCS
Accumulate
2,471
2,651
486,853
117,966
127,403
27.5
27.6
134.3
144.5
18.4
17.1
5.5
5.1
29.8
29.7
3.8
3.5
Tech Mahindra
Buy
397
533
38,707
29,141
31,051
14.4
15.0
32.3
35.6
12.3
11.2
2.1
1.9
17.1
17.0
1.2
1.0
Wipro
Buy
256
570
124,598
55,421
58,536
20.3
20.3
35.1
36.5
7.3
7.0
1.3
1.1
19.2
14.6
1.7
1.4
Media
D B Corp
Neutral
375
-
6,902
2,297
2,590
27.4
28.2
21.0
23.4
17.9
16.0
4.2
3.6
23.7
23.1
2.8
2.4
HT Media
Neutral
81
-
1,892
2,693
2,991
12.6
12.9
7.9
9.0
10.3
9.0
0.9
0.8
7.8
8.3
0.3
0.2
Jagran Prakashan
Buy
183
225
5,971
2,283
2,555
28.0
28.0
10.6
12.3
17.2
14.9
3.7
3.2
21.4
21.4
2.6
2.3
Sun TV Network
Neutral
825
-
32,518
2,850
3,265
70.1
71.0
26.2
30.4
31.5
27.1
8.1
7.1
24.3
25.6
11.0
9.5
Hindustan Media
Neutral
276
-
2,023
1,016
1,138
24.3
25.2
27.3
30.1
10.1
9.2
1.9
1.7
16.2
15.8
1.3
1.1
Ventures
TV Today Network
Buy
263
344
1,567
608
667
21.5
22.3
15.7
19.2
16.7
13.7
2.6
2.2
16.1
16.0
2.2
1.9
Metals & Mining
Coal India
Neutral
257
-
159,717
84,638
94,297
21.4
22.3
24.5
27.1
10.5
9.5
4.4
4.2
42.6
46.0
1.4
1.3
Hind. Zinc
Neutral
243
-
102,781
14,252
18,465
55.9
48.3
15.8
21.5
15.4
11.3
2.5
2.2
17.0
20.7
7.2
5.6
Hindalco
Neutral
200
-
44,801
107,899
112,095
7.4
8.2
9.2
13.0
21.7
15.4
1.1
1.0
4.8
6.6
0.9
0.9
JSW Steel
Neutral
198
-
47,837
53,201
58,779
16.1
16.2
130.6
153.7
1.5
1.3
0.2
0.2
14.0
14.4
1.7
1.4
NMDC
Neutral
112
-
35,341
6,643
7,284
44.4
47.7
7.1
7.7
15.7
14.5
1.4
1.3
8.8
9.2
3.1
2.8
SAIL
Neutral
56
-
23,067
47,528
53,738
(0.7)
2.1
(1.9)
2.6
21.5
0.6
0.6
(1.6)
3.9
1.3
1.2
Vedanta
Neutral
236
-
87,707
71,744
81,944
19.2
21.7
13.4
20.1
17.6
11.7
1.5
1.4
8.4
11.3
1.6
1.3
Tata Steel
Neutral
503
-
48,838
121,374
121,856
7.2
8.4
18.6
34.3
27.0
14.7
1.7
1.5
6.1
10.1
1.0
1.0
Oil & Gas
GAIL
Neutral
381
-
64,413
56,220
65,198
9.3
10.1
27.1
33.3
14.1
11.4
1.3
1.2
9.3
10.7
1.3
1.1
ONGC
Neutral
170
-
217,523
137,222
152,563
15.0
21.8
19.5
24.1
8.7
7.0
0.7
0.7
8.5
10.1
1.9
1.7
Indian Oil Corp
Neutral
421
-
204,288
373,359
428,656
5.9
5.5
54.0
59.3
7.8
7.1
1.2
1.1
16.0
15.6
0.7
0.6
Stock Watch
June 15, 2017
Company Name
Reco
CMP
Target
Mkt Cap
Sales ( Čcr )
OPM(%)
EPS (Č)
PER(x)
P/BV(x)
RoE(%)
EV/Sales(x)
(Č)
Price ( Č)
( Č cr )
FY17E FY18E
FY17E
FY18E
FY17E
FY18E
FY17E
FY18E
FY17E
FY18E
FY17E
FY18E
FY17E
FY18E
Oil & Gas
Reliance Industries
Neutral
1,356
-
440,862
301,963
358,039
12.1
12.6
87.7
101.7
15.5
13.3
1.6
1.4
10.7
11.3
1.9
1.6
Pharmaceuticals
Alembic Pharma
Buy
535
648
10,080
3,101
3,966
19.7
20.5
21.4
25.5
25.0
21.0
5.3
4.3
23.0
22.8
3.2
2.4
Alkem Laboratories Ltd
Buy
1,866
2,161
22,308
5,853
6,901
17.1
18.4
74.6
85.0
25.0
22.0
5.3
4.4
21.1
20.2
3.8
3.2
Aurobindo Pharma
Buy
601
823
35,238
14,845
17,086
21.5
22.1
39.4
44.7
15.3
13.5
3.8
3.0
27.6
24.7
2.5
2.2
Aventis*
Neutral
4,077
-
9,389
2,206
2,508
16.6
16.8
128.9
139.9
31.6
29.1
5.4
4.2
21.6
23.5
4.0
3.4
Cadila Healthcare
Reduce
529
450
54,141
9,220
11,584
18.4
20.3
14.5
18.7
36.5
28.3
7.8
6.3
23.5
24.6
6.2
4.7
Cipla
Reduce
540
461
43,426
14,281
16,619
15.4
16.2
12.5
19.7
43.2
27.4
3.5
3.1
8.4
12.0
3.2
2.7
Dr Reddy's
Neutral
2,665
-
44,153
14,081
15,937
16.1
18.6
72.6
105.9
36.7
25.2
3.6
3.2
9.6
13.6
3.4
3.0
Dishman Pharma
Sell
143
1,718
1,890
22.7
22.8
9.5
11.3
10.1
10.9
3.3
2.9
GSK Pharma*
Neutral
2,458
-
20,817
2,927
3,290
11.8
16.2
34.4
49.6
71.4
49.6
10.4
10.8
13.9
21.3
6.9
6.2
Indoco Remedies
Sell
193
153
1,778
1,067
1,154
12.1
14.9
8.4
11.3
23.0
17.1
2.7
2.4
12.6
15.0
1.9
1.8
Ipca labs
Buy
509
710
6,419
3,211
3,593
13.9
14.5
15.4
19.4
33.0
26.2
2.6
2.4
8.2
9.5
2.1
1.9
Lupin
Buy
1,181
1,526
53,332
17,120
18,657
24.1
24.1
56.9
61.1
20.8
19.3
3.9
3.3
20.7
18.6
3.4
2.8
Natco Pharma
Accumulate
1,004
1,060
17,494
2,065
1,988
33.1
33.7
27.9
25.7
36.0
39.0
10.5
8.9
29.2
22.9
8.6
8.7
Sun Pharma
Buy
539
712
129,199
30,264
32,899
29.0
26.9
32.7
31.6
16.5
17.0
3.5
3.0
22.2
18.7
4.0
3.6
Power
Tata Power
Neutral
78
-
20,976
36,916
39,557
17.4
27.1
5.1
6.3
15.2
12.3
1.3
1.2
9.0
10.3
1.6
1.4
NTPC
Neutral
160
-
131,804
86,605
95,545
17.5
20.8
11.8
13.4
13.6
11.9
1.4
1.3
10.5
11.1
2.9
2.9
Power Grid
Accumulate
210
223
109,916
25,315
29,193
88.2
88.7
14.2
17.2
14.8
12.2
2.3
2.0
15.2
16.1
9.0
8.1
Real Estate
Prestige Estate
Neutral
265
-
9,947
4,707
5,105
25.2
26.0
10.3
13.0
25.8
20.4
2.1
1.9
10.3
10.2
3.3
2.9
MLIFE
Buy
447
522
2,292
1,152
1,300
22.7
24.6
29.9
35.8
14.9
12.5
1.1
1.0
7.6
8.6
2.7
2.3
Telecom
Bharti Airtel
Neutral
365
-
145,945
105,086
114,808
34.5
34.7
12.2
16.4
29.9
22.3
2.0
1.9
6.8
8.4
2.3
2.0
Idea Cellular
Neutral
77
-
27,785
40,133
43,731
37.2
37.1
6.4
6.5
12.0
11.9
1.0
0.9
8.2
7.6
1.7
1.5
zOthers
Abbott India
Neutral
4,283
-
9,101
3,153
3,583
14.1
14.4
152.2
182.7
28.1
23.4
138.2
118.0
25.6
26.1
2.6
2.2
Asian Granito
Accumulate
398
447
1,199
1,066
1,169
11.6
12.5
13.0
16.0
30.7
24.9
3.0
2.7
9.5
10.7
1.4
1.3
Bajaj Electricals
Accumulate
349
395
3,538
4,801
5,351
5.7
6.2
10.4
13.7
33.5
25.5
4.1
3.7
12.4
14.5
0.7
0.7
Banco Products (India)
Neutral
221
-
1,577
1,353
1,471
12.3
12.4
14.5
16.3
15.2
13.5
21.0
18.9
14.5
14.6
1.1
118.8
Coffee Day Enterprises
Neutral
246
-
5,067
2,964
3,260
20.5
21.2
4.7
8.0
-
30.7
2.8
2.6
5.5
8.5
2.1
1.9
Ltd
Competent Automobiles Neutral
201
-
129
1,137
1,256
3.1
2.7
28.0
23.6
7.2
8.5
38.7
34.9
14.3
11.5
0.1
0.1
Elecon Engineering
Neutral
60
-
678
1,482
1,660
13.7
14.5
3.9
5.8
15.5
10.4
3.6
3.3
7.8
10.9
0.8
0.7
Stock Watch
June 15, 2017
Company Name
Reco
CMP
Target
Mkt Cap
Sales ( Čcr )
OPM(%)
EPS (Č)
PER(x)
P/BV(x)
RoE(%)
EV/Sales(x)
(Č)
Price ( Č)
( Č cr )
FY17E
FY18E
FY17E
FY18E
FY17E
FY18E
FY17E
FY18E
FY17E
FY18E
FY17E
FY18E
FY17E
FY18E
zOthers
Finolex Cables
Neutral
508
-
7,776
2,883
3,115
12.0
12.1
14.2
18.6
35.8
27.3
19.0
16.7
15.8
14.6
2.4
2.2
Garware Wall Ropes
Neutral
850
-
1,859
863
928
15.1
15.2
36.4
39.4
23.3
21.6
4.2
3.6
17.5
15.9
2.1
1.9
Goodyear India*
Neutral
877
-
2,022
1,598
1,704
10.4
10.2
49.4
52.6
17.7
16.7
81.9
71.9
18.2
17.0
1.0
135.4
Hitachi
Neutral
2,042
-
5,552
2,081
2,433
8.8
8.9
33.4
39.9
61.1
51.2
49.3
41.1
22.1
21.4
2.7
2.2
HSIL
Neutral
391
-
2,825
2,384
2,515
15.8
16.3
15.3
19.4
25.5
20.1
25.4
21.8
7.8
9.3
1.4
1.2
Interglobe Aviation
Neutral
1,155
-
41,756
21,122
26,005
14.5
27.6
110.7
132.1
10.4
8.7
62.4
44.6
168.5
201.1
2.0
1.5
Jyothy Laboratories
Neutral
379
-
6,883
1,440
2,052
11.5
13.0
8.5
10.0
44.6
37.9
10.8
10.0
18.6
19.3
5.1
3.5
Kirloskar Engines India
Neutral
386
-
5,584
2,554
2,800
9.9
10.0
10.5
12.1
36.8
31.9
15.4
14.5
10.7
11.7
1.8
1.6
Ltd
Linc Pen & Plastics
Neutral
276
-
408
382
420
9.3
9.5
13.5
15.7
20.5
17.6
3.5
3.0
17.1
17.3
1.1
1.0
M M Forgings
Neutral
610
-
736
546
608
20.4
20.7
41.3
48.7
14.8
12.5
83.6
74.0
16.6
17.0
1.2
1.1
Manpasand Bever.
Neutral
772
-
4,416
836
1,087
19.6
19.4
16.9
23.8
45.7
32.4
5.5
4.8
12.0
14.8
5.0
3.8
Mirza International
Neutral
159
-
1,907
963
1,069
17.2
18.0
6.1
7.5
25.9
21.1
4.0
3.4
15.0
15.7
2.2
2.0
MT Educare
Neutral
64
-
255
366
417
17.7
18.2
9.4
10.8
6.9
5.9
1.5
1.3
22.2
22.3
0.6
0.5
Narayana Hrudaya
Neutral
329
-
6,713
1,873
2,166
11.5
11.7
2.6
4.0
124.2
82.9
7.6
6.9
6.1
8.3
3.7
3.2
Navkar Corporation
Buy
221
265
3,155
347
371
43.2
37.3
6.7
6.0
33.2
36.9
2.3
2.0
6.2
10.6
10.2
9.5
Navneet Education
Neutral
184
-
4,300
1,062
1,147
24.0
24.0
6.1
6.6
30.2
27.8
6.2
5.5
20.6
19.8
4.1
3.8
Nilkamal
Neutral
1,967
-
2,935
1,995
2,165
10.7
10.4
69.8
80.6
28.2
24.4
112.4
97.6
16.6
16.5
1.5
1.3
Page Industries
Neutral
16,367
-
18,256
2,450
3,124
20.1
17.6
299.0
310.0
54.7
52.8
364.5
278.3
47.1
87.5
7.5
5.9
Parag Milk Foods
Neutral
228
-
1,919
1,919
2,231
9.3
9.6
9.5
12.9
24.2
17.6
3.8
3.1
15.5
17.5
1.2
1.0
Quick Heal
Neutral
210
-
1,474
408
495
27.3
27.0
7.7
8.8
27.2
23.9
2.5
2.5
9.3
10.6
2.8
2.3
Radico Khaitan
Buy
123
147
1,632
1,667
1,824
13.0
13.2
6.7
8.2
18.5
15.0
1.7
1.5
9.0
10.2
1.4
1.2
Relaxo Footwears
Neutral
483
-
5,803
2,085
2,469
9.2
8.2
7.6
8.0
63.9
60.8
24.8
21.2
17.9
18.8
2.9
2.5
S H Kelkar & Co.
Neutral
285
-
4,127
1,036
1,160
15.1
15.0
6.1
7.2
46.7
39.8
5.0
4.6
10.7
11.5
3.9
3.4
Siyaram Silk Mills
Accumulate
2,310
2,500
2,166
1,574
1,769
12.5
12.7
97.1
113.1
23.8
20.4
3.7
3.2
15.4
15.5
1.6
1.4
Styrolution ABS India*
Neutral
830
-
1,459
1,440
1,537
9.2
9.0
40.6
42.6
20.4
19.5
52.2
47.4
12.3
11.6
1.0
0.9
Surya Roshni
Neutral
282
-
1,235
3,342
3,625
7.8
7.5
17.3
19.8
16.3
14.3
31.0
24.9
10.5
10.8
0.6
0.6
Team Lease Serv.
Neutral
1,340
-
2,290
3,229
4,001
1.5
1.8
22.8
32.8
58.8
40.8
6.3
5.5
10.7
13.4
0.6
0.5
The Byke Hospitality
Neutral
190
-
762
287
384
20.5
20.5
7.6
10.7
25.0
17.8
5.2
4.2
20.7
23.5
2.7
2.0
Transport Corporation of
Neutral
311
-
2,384
2,671
2,911
8.5
8.8
13.9
15.7
22.5
19.9
3.1
2.7
13.7
13.8
1.0
0.9
India
Stock Watch
June 15, 2017
Company Name
Reco
CMP
Target Mkt Cap
Sales ( Čcr )
OPM(%)
EPS (Č)
PER(x)
P/BV(x)
RoE(%)
EV/Sales(x)
(Č)
Price ( Č)
( Č cr )
FY17E FY18E FY17E FY18E FY17E FY18E FY17E FY18E FY17E FY18E FY17E FY18E FY17E FY18E
zOthers
TVS Srichakra
Neutral
4,107
-
3,145
2,304
2,614
13.7
13.8
231.1
266.6
17.8
15.4
461.5
363.4
33.9
29.3
1.4
1.2
UFO Moviez
Neutral
414
-
1,143
619
685
33.2
33.4
30.0
34.9
13.8
11.9
1.9
1.7
13.8
13.9
1.6
1.2
Visaka Industries
Neutral
478
-
759
1,051
1,138
10.3
10.4
21.0
23.1
22.8
20.7
61.3
57.4
9.0
9.2
1.0
0.9
VRL Logistics
Neutral
318
-
2,902
1,902
2,119
16.7
16.6
14.6
16.8
21.8
18.9
4.8
4.2
21.9
22.2
1.6
1.4
VIP Industries
Accumulate
195
218
2,762
1,270
1,450
10.4
10.4
5.6
6.5
34.9
30.1
7.2
6.3
20.7
21.1
2.2
1.9
Navin Fluorine
Accumulate
3,211
3,650
3,144
789
945
21.1
22.4
120.1
143.4
26.7
22.4
4.3
3.7
17.8
18.5
3.9
3.2
Source: Company, Angel Research; Note: *December year end; #September year end; &October year end; Price as on June 14, 2017
Market Outlook
June 15, 2017
Research Team Tel: 022 - 39357800
DISCLAIMER
Angel Broking Private Limited (hereinafter referred to as “Angel”) is a registered Member of National Stock Exchange of India
Limited,Bombay Stock Exchange Limited and Metropolitan Stock Exchange Limited. It is also registered as a Depository Participant with
CDSL and Portfolio Manager with SEBI. It also has registration with AMFI as a Mutual Fund Distributor. Angel Broking Private Limited is a
registered entity with SEBI for Research Analyst in terms of SEBI (Research Analyst) Regulations, 2014 vide registration number
INH000000164. Angel or its associates has not been debarred/ suspended by SEBI or any other regulatory authority for accessing
/dealing in securities Market. Angel or its associates/analyst has not received any compensation / managed or
co-managed public offering of securities of the company covered by Analyst during the past twelve months.
This document is solely for the personal information of the recipient, and must not be singularly used as the basis of any investment
decision. Nothing in this document should be construed as investment or financial advice. Each recipient of this document should make
such investigations as they deem necessary to arrive at an independent evaluation of an investment in the securities of the companies
referred to in this document (including the merits and risks involved), and should consult their own advisors to determine the merits and
risks of such an investment.
Reports based on technical and derivative analysis center on studying charts of a stock's price movement, outstanding positions and
trading volume, as opposed to focusing on a company's fundamentals and, as such, may not match with a report on a company's
fundamentals. Investors are advised to refer the Fundamental and Technical Research Reports available on our website to evaluate the
contrary view, if any.
The information in this document has been printed on the basis of publicly available information, internal data and other reliable
sources believed to be true, but we do not represent that it is accurate or complete and it should not be relied on as such, as this
document is for general guidance only. Angel Broking Pvt. Limited or any of its affiliates/ group companies shall not be in any way
responsible for any loss or damage that may arise to any person from any inadvertent error in the information contained in this report.
Angel Broking Pvt. Limited has not independently verified all the information contained within this document. Accordingly, we cannot
testify, nor make any representation or warranty, express or implied, to the accuracy, contents or data contained within this document.
While Angel Broking Pvt. Limited endeavors to update on a reasonable basis the information discussed in this material, there may be
regulatory, compliance, or other reasons that prevent us from doing so.
This document is being supplied to you solely for your information, and its contents, information or data may not be reproduced,
redistributed or passed on, directly or indirectly.
Neither Angel Broking Pvt. Limited, nor its directors, employees or affiliates shall be liable for any loss or damage that may arise from
or in connection with the use of this information.